
Data scientists are often faced with the need to work with imbalanced datasets. Indeed, imbalanced classes are a common problem in machine learning classification, where there’s a disproportionate ratio of observations in each class.
Class imbalance can be found in a variety of areas, including AdTech, medical diagnosis, spam filtering and fraud detection. But most machine learning algorithms work best with the number of samples in each class are roughly equal. This is because most algorithms are designed to maximize accuracy and reduce error.
How to Deal With Imbalanced Datasets?
In this article, we offer guidelines for working with imbalanced datasets. But before doing any of what we recommend, you should first identify whether you can collect more data. Getting more of your undersampled class is always the best solution.
After you’ve collected as much data as possible, dealing with imbalanced datasets involves choosing three things: the right metric, what resampling method(s) to use, and the right modeling framework once you’ve pre-processed your data.
Choosing the Right Metric
The Accuracy Paradox is the paradoxical finding that accuracy is not a good metric for predictive models when classifying in predictive analytics. This is because a simple model may have a high level of accuracy but be too crude to be useful. For example, if the incidence of female VS males is dominant, being found in 99% of cases, then predicting that every case is female will have an accuracy of 99%.
A closer look at this paradoxical behavior will reveal two types of misclassifications: false positives and false negatives. In an example involving fire alarms, a false positive would involve predicting that there is a fire (predicting positive) when there isn’t; and a false negative would be mistakenly predicting that there is no fire (predicting negative) when there actually is. In the case of the accuracy paradox, we can see that all of our mistakes were predicting positive (meaning that there is a fire) as not fire, since all the predictions we made were only not fire. This leaves us with as many false negatives as there are negative observations.

To more closely examine where we were accurate or inaccurate with respect to false positives and false negatives, we need to look at the closely related metrics precision and recall. To fully evaluate the effectiveness of a model, you must examine both precision and recall. Precision and recall are alternative performance metrics:
- Precision: What proportion of positive identifications was actually correct?

- Recall: What proportion of actual positives was identified correctly?


Unfortunately, precision and recall are by nature in tension. That is, improving precision typically reduces recall, and vice versa. The importance of precision versus recall depends on the business logic of the problem. For example, in the case of the fire alarm, we’ll want to catch all fires, even at the cost of triggering a false alarm every once in a while. This translates to recall being much more important than precision.
The opposite case can be seen in YouTube recommendations, for example. False negatives are taken lightly since there is no real harm in recommending something you might not like. At the same time, the benefits of recommending something you didn’t know about and might like outweigh the risks of you merely skipping the video.
To get the full picture of the false positive and false negative map of your prediction, we recommend looking at your model’s scores in the framework of a confusion matrix.
Finally, if you’re aiming to choose a single metric rather than dealing with two metrics simultaneously, you might want to consider an F1 score. The F1 score is the harmonic mean of the precision and recall, where an F1 score reaches its best value at 1 (perfect precision and recall) and worst at 0.

Resampling Methods
Data scientists have a number of resampling methods to choose from, each offering their own advantages and disadvantages. Here, we’ll focus on a few of the more popular resampling methods used in the industry. Since different modeling tasks might require different resampling methods, we advise you to try out a few methods to explore which works best for your specific problem.
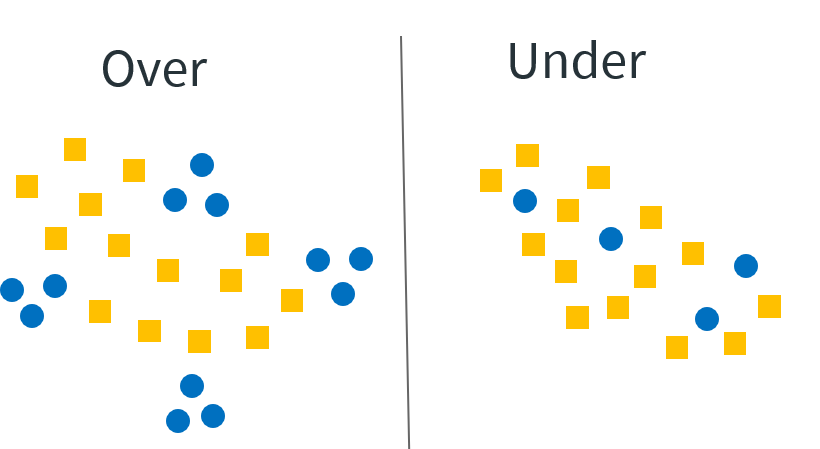
- Random undersampling
In random undersampling, you select random observations from the over represented class. This should be used as a baseline for the more complicated modeling effort. Note that this method might create increasing biases as the ratio between the over- and under-represented labels grows. The biases are due to the fact that the random sample might not sample from entire regions of the feature space if the imbalance is too large. For example, imagine that the labels are purchasers in some game app, and we have three hounded and sixty thousand non-purchasers. In addition to this, every row in the data indicates the age and gender of the user. If we down sample to a ratio of 1:1, we might not sample negative labels of female users below a certain age, or generally have our sample not represent the population from which it was sampled due to the small sample size. This might result in some of the features appearing much more influential in predicting the label than they actually are.
- Random oversampling
In random oversampling, you duplicate random observations from the underrepresented class. As in the case of random under sampling, this sampling method can be used as a baseline for a more complicated modeling efforts. Note that you should always split into “test” and “train” sets before trying oversampling techniques. Oversampling before splitting the data can allow the exact same observations to be present in both the “test” and “train” sets. In addition, as the positive labels are duplicated many times, it is very common to have the model overfit the training data when using random oversampling.
- Cluster Centroids
In this resampling method, apply some clustering algorithm to the data, assign each datapoint to a cluster and perform undersampling by cluster in proportion equal to the size of the cluster. This aims to solve the problem of the regions in the feature space that might not be represented in random down sampling. If we return to the user age and gender example, the clustering model will determine that there are K clusters in the data according to the feature space; one cluster might be older females and another might be younger males, etc. The sampling will then be done by sampling from each cluster proportionally to its size in the data and not uniformly from the entire dataset. As a result, the down sampled data is bound to more accurately represent the real population (the one from which we sampled).
SMOTE (Synthetic Minority Oversampling Algorithm)
This resampling method generates new minority class samples along the lines between an observation and each of its nearest minority neighbors. One advantage of this method is that it allows you to avoid overfitting, which occurs when exact replicas of minority instances are added in random oversampling. This method helps emphasize the regions in which there is a large proportion of positive labels rather then overfitting on a single positive observation that might not generalize.

Choosing the Right Modeling Frameworks
Trying a variety of algorithms is a great rule of thumb anytime you encounter a machine learning problem. And doing so is especially beneficial when you’re working with imbalanced datasets.
Decision trees generally perform well on imbalanced data. They work by minimizing the entropy in the data by learning a hierarchy of “if/else” questions.
Some models allow you to assign weights on the loss function in order to treat classes where the dataset consists of classes that are unequal in size. In the scikit-learn framework, this is usually called “class_weights” and it often takes in a dictionary that defines by how much each class should be penalized. This parameter also exists in the XGBoost framework, where it’s called “scale_pos_weight.”
Whatever modeling framework you choose, we recommend starting by reading the documentation and checking whether the model supports some kind of loss function penalty for the case of imbalanced data.
Conclusion
As we mentioned, the problem of imbalanced data is a common one. Don’t let it intimidate you. While working with imbalanced data is certainly challenging, it’s also doable so long as you plan carefully while following the guidelines we’ve provided here.
You should always start small. Read up on a method and ensure that you know exactly what’s going on under the hood. If you find that a method is bringing you value, you can further tune it by trying different methods from the same family.
Also, respect the baseline. Compare everything you do to a simple baseline to ensure that you’re not wasting your time, and that by implementing these methods on your data you are actually moving the needle enough. The simplest and strongest baselines we suggest are random oversampling and random undersampling.
Finally, use an external library. As is the case 99% of the time in data science, you’re not the first person to encounter the problem you’re facing! Look for open source libraries that solve the problem you’re working with. If python is your weapon of choice for data science (as it should be!), we recommend Imbalanced-learn (link below).
If you’d like to work with Ido Zehori and his savvy team of data scientists to grow your app please click the “Contact Us” button below.