
|
RT 101
CHAPTER 3
Setting up retargeting right
Why 90% reach can be worth less than 40%
What separates a partner who reaches your users from one who knows which are worth reaching.

01
You already paid for your next growth curve
READ NOW >>
02
Your ROAS is lying to you. Here’s the number that isn’t
READ NOW >>
03
Why 90% reach can be worth less than 40%
Currently Reading
CHAPTER 3
SETTING UP RETARGETING RIGHT
Why 90% reach can be worth less than 40%
Three partners, three numbers, one word
Ask three retargeting partners the same question, “how much of my churned base can you reach?” (also known as match rate), and you’ll get three confident answers. One says 90%. One says 60%. One says 40%.
The instinct is to rank them in that order. The instinct is wrong, because those numbers aren’t measuring the same thing. Reach is one word doing two jobs.
The first is coverage: how many of your churned users a partner can technically serve an impression to. The second is selection: how many of your churned users a partner chooses to bid on, because the model prices them as worth the media.
Coverage is easy. Most of your users appear in the open exchanges eventually, so a partner that bids on everyone has “reached” 90% of the list on day one. No decision was made.
Bidding on 40% is a different statement. It means the other 60% were evaluated and declined. Some would have returned organically, and paying for natural returns is the most expensive mistake in retargeting. Some were never worth a bid at any price. Separating those, user by user, is where the actual work lives, and a coverage number doesn’t show it.
So don’t just ask “what’s your reach/match rate.” Ask what decides who doesn’t get an impression.
Ask how reach is calculated
Before any of that, there’s a more basic problem: nobody agrees how to count coverage in the first place.
Here is what the question actually looks like in practice. You hand a partner a list, say everyone who purchased in the last week, and ask how many of those users they have seen in their traffic. That answer depends entirely on how far back the partner looks. Seen yesterday is one number. Seen in the last week is larger. Seen in the last month is larger again, because the further back you go, the more of your list turns up somewhere.
Say a partner sees 15% of your list in a single day, 30% across a week, and 45% across a month. All three are true, and all three describe the same capability.
Now put two partners side by side. One reports 45% on a monthly window. The other reports 15% on a daily window. The first looks three times larger, and it may well be the weaker of the two: a partner that sees 15% of your base every single day is touching more of it over a month than one reporting 45% across the whole month. You compared two windows, not two partners, and the comparison hid the better option.
one partner, three loopback windows
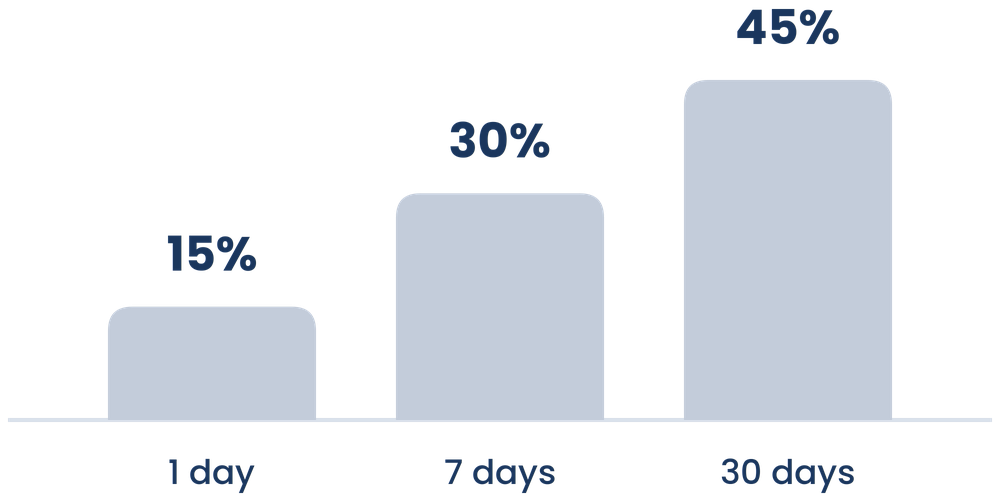
three true numbers.
The fix is to mandate a uniform lookback window across every partner, 7-day or 30-day, and require them to report reach against that exact timeframe. Without it you aren’t comparing apples to apples, you’re comparing two different measurements that share a name. If a partner can’t state the window behind the number, the reach isn’t a measurement. It’s noise.
What decides who’s worth a bid
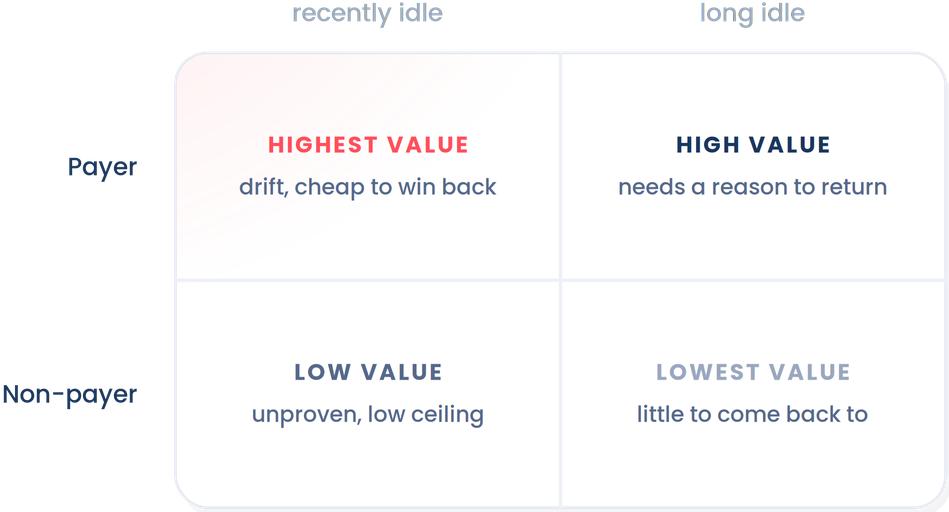
Strip away the modeling and the auction mechanics, and two first-party fields carry most of the predictive signal. You already have both.
Payer status. A user who converted to payer crossed the hardest line in mobile gaming. That’s the one attribute no model can reliably infer about a net-new user, and it predicts future LTV better than anything else in the dataset. A churned payer and a churned non-payer are different assets, and pricing them the same leaves money on both sides of the trade.
Recency (inactivity window). Nine days of inactivity and nine months are different problems. Recent churn is often drift, and drifting users can be won back at low cost. Deep churn needs a real reason to return, and the bid has to carry that cost. Same list, very different prices.
Payer status and the inactivity window set the frame. Everything else refines it.
Progression is the clearest of the secondary signals. A user who reached level 40 built something worth returning to: progress, unlocks, a collection. A user who quit in the tutorial left nothing behind, and no creative brings them back to something they never had.
The model reads more besides: session frequency and length, spend depth and cadence, where users stalled, and how the game was monetizing them before they left. None of these outweighs payer status or recency on its own. Together they separate two users who look identical on a spreadsheet and behave nothing alike.
Put it together and the segmentation sharpens fast. A payer at level 40, idle three weeks, is not the same opportunity as a non-payer who quit in the tutorial, idle three weeks. They shouldn’t get the same creative, and they definitely shouldn’t get the same bid.
two fields set the frame
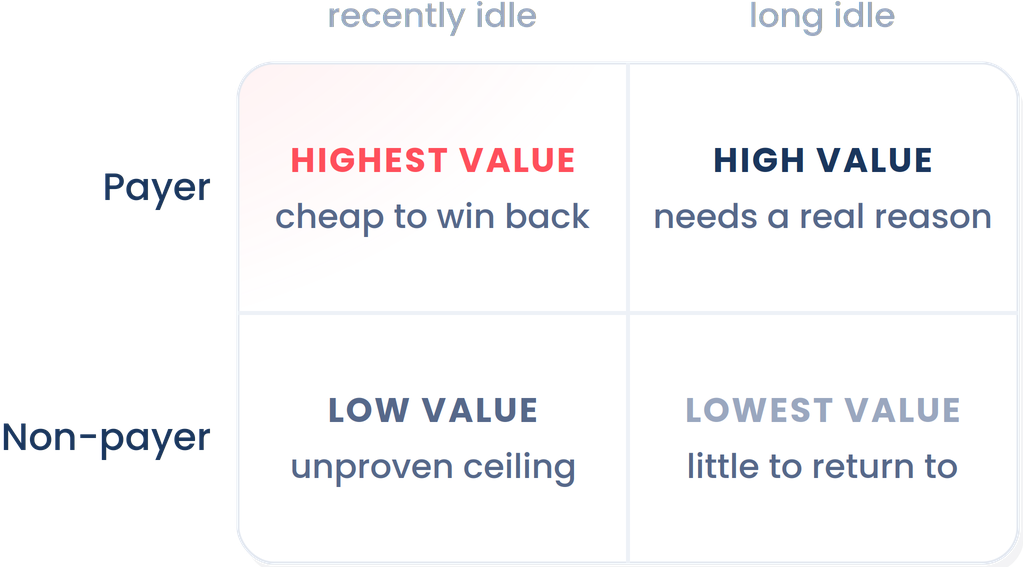
A payer at level 40 is not the same opportunity
as a non-payer who quit the tutorial.
Same idle window.
One campaign, a bid per user
This is where most retargeting setups quietly leak budget.
The standard approach: define an audience, assign it a flat bid, launch. Everyone in the segment gets the same price, so the campaign overpays for the lowest-value user in the group and underbids the highest-value one, every auction, all day. And in a churned audience, the highest-value user can be worth many multiples of the median.
The better structure runs several audiences in parallel with user-level bidding: every user is priced individually. The audience decides who’s eligible. The model decides what each user is worth right now, in this auction, given their in-app history and their probability of returning organically.
Two users, same segment, very different bids. Because they’re very different bets.
five users, two bid structures
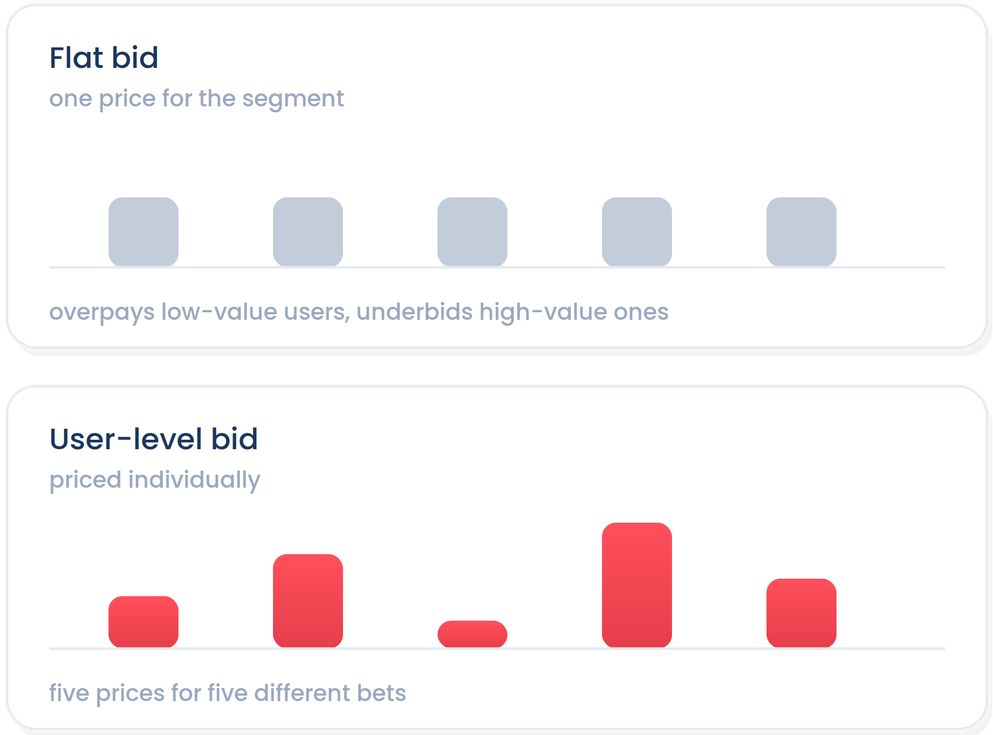
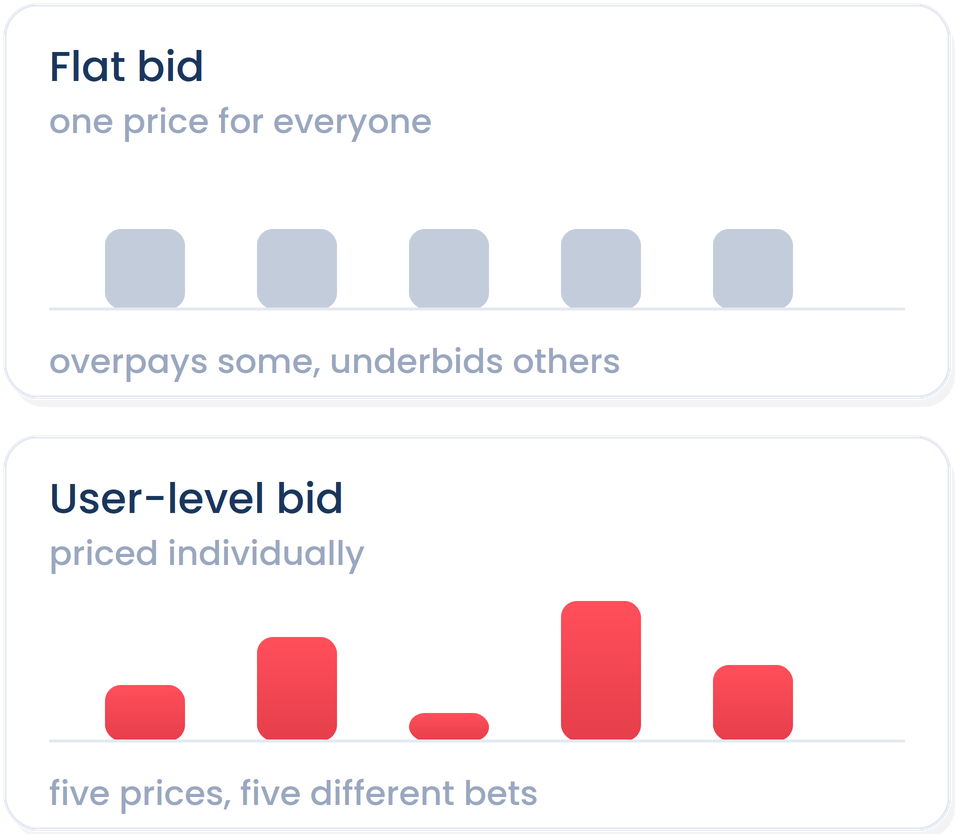
Very different bets.
Data sharing directly drives programmatic efficiency. A machine learning or deep learning model can only price what it can see. When you share rich, user-level data, including unattributed user signals, the model evaluates each user’s true worth. If your partner uses model-driven bidding and user-level pricing, granular data isn’t a nice-to-have. It’s the exact engine required to maximise incremental return.
You don’t need to run that machinery yourself. You do need to know whether your partner does. “What’s your bid strategy” and “do you price at the user level” sound like the same question. The answers will tell you they’re not.
Every event you share sharpens targeting and pricing
Retargeting quality is a direct function of the signals the models can see. That’s not a sales line, it’s arithmetic: a model choosing between two users can only price the differences it’s allowed to observe.
The practical consequence is a hierarchy, and the layers are not equal. Install date and idle days alone let a partner rank the base by recency, and nothing more. Purchase events add payer status, which is the single largest step up available to you. Progression, session patterns and stall points add the texture that separates users the first two fields treat as identical. Each layer earns its integration effort, and knowing the order tells you what to prioritize.
Thin data produces undifferentiated bidding. Rich data produces selection. Selection is the 40% from the top of this chapter.
Two things worth saying plainly. Your event data prices your own media; nothing here builds a cross-app profile of your users. And if a partner can’t tell you which events would change their bidding and which are decorative, that answer is itself an answer.
Retargeting creative, not recycled UA assets
Returning users already know your game. Serving them generic UA ads tells them nothing and signals that you don’t recognise them, which wastes your ad spend.
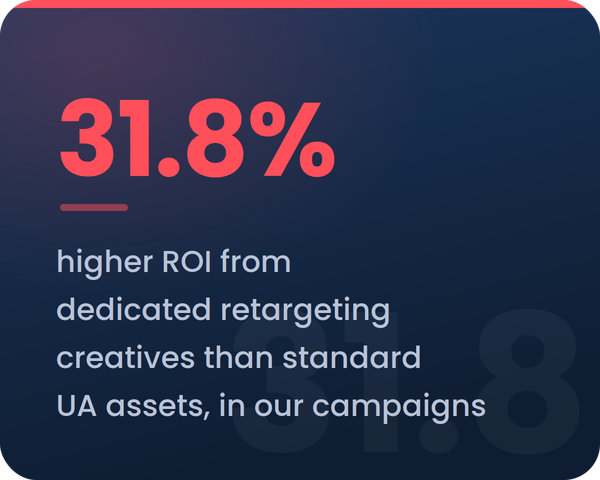
Effective retargeting creatives do a completely different job: they speak directly to churned users by showing what’s new, what’s waiting, or where they left off. The impact of tailored creative is measurable: in our campaigns, dedicated retargeting creatives delivered a 31.8% higher ROI than standard UA assets.

Customizing your ad creative for retargeting is the cheapest performance lever in your entire program. It costs a simple production cycle, not extra media budget.
The catch, one last time
Everything in this chapter makes retargeting perform better. None of it tells you whether it worked. A perfectly selected audience, priced per user, served tailored creative, can still be taking credit for natural returns.
That’s why the setup chapter comes last and the measurement chapter comes before it. Selection decides what you pay. Only a control group, measured against your Natural Return Rate, tells you what you got.
Where this leaves you
Three chapters, one argument. The users you already paid for are the cheapest incremental growth available to you. The only proof that retargeting worked is a control group. And the setup that earns its budget is selection, not coverage: the right users, priced one by one, served creative made for coming back.
That’s RT 101. The course area holds the working tools: the setup checklists, the measurement math worked end to end, and the full list of questions to ask any retargeting partner before you sign. It keeps growing as the series does.
RT 101 is written by Bigabid, the retargeting DSP for mobile games. No fluff, no black boxes.
New chapters land in your inbox first, and the course area updates the same day.