Measuring the Performance of App Retargeting Campaigns
By Data Scientist, Mia Dor
“Advertising efficiency can be improved based on historical data known about the user activity in the advertised app. Using data on user interests and behavior outside of the customer app can improve results even further.”
Measuring the Performance of App Retargeting Campaigns

By Data Scientist,
Mia Dor
Measuring the Performance of App Retargeting Campaigns
It’s complicated but completely doable.
An app retargeting campaign, also called an “app re-engagement campaign”, is targeted toward users of an app who previously installed the app, were active for some time, and have churned. Because the audience is accurate and relevant, these campaigns can be highly effective and profitable – if done correctly. Furthermore, advertising efficiency can be improved based on historical data known about the user activity in the advertised app. Using data on user interests and behavior outside of the customer app can improve results even further.
Measuring the performance of a retargeting campaign to price its value and improve it – as opposed to measuring a user acquisition (UA) campaign – can be difficult. This is mainly because of two challenging characteristics of measuring retargeting campaigns that aren’t especially problematic for UA campaigns:
To properly measure a retargeting campaign, we first need to randomly split all the relevant users into two groups: a treatment group and a control group. The users of the treatment group are displayed ads of the advertised app and are sometimes offered bonuses like free coins for returning to the app through the ad. The users of the control group are not shown ads of the app at all. Thus, it’s possible to compare the two groups and understand the extent to which the retargeting campaign added to the NRR of users to the app, and how much it increased sales within the app. The NRR is measured by the control group.
Discover more about how Bigabid applies treatment and control groups to retargeting campaigns in 4 Pillars for Successful Retargeting.
How should experiments using a treatment group and control groups be performed?
First, the audience needs to be divided into two groups randomly. The groups don’t have to be the same size, but we recommend keeping the sizes as close as possible to avoid there being a different noise level in the measurements of the two groups. Next, two parallel campaigns should be performed, each targeting one of the groups.
There are two ways to perform the experiment:
The table below shows the differences between the two methods:
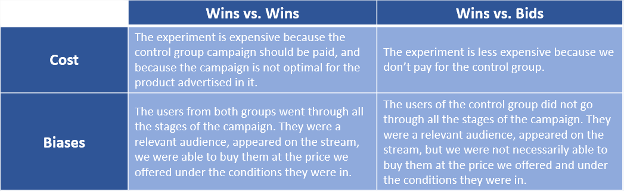
Differences between the “Wins vs. Wins” and “Wins vs. Bids” methods
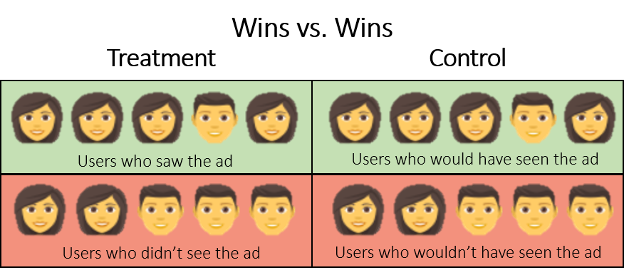
Users who saw the ad can be different from those who did not see it. In the Wins vs. Wins method, we can tell which users would see the ad in both the treatment group and the control group.
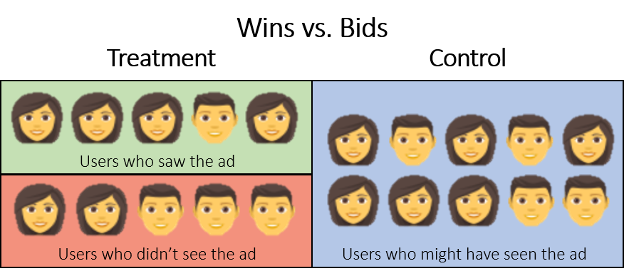
Users who saw the ad can be different from those who did not see it. In the Wins vs. Bids method, we can tell which users would see the ad only in the treatment group and not in the control group.
In the experiments we performed, we saw no significant difference between the performance measured in the two different methods. This may indicate that the bias generated by the Wins vs. Bids method is small, and can be significantly reduced by statistical tools, thus reducing the experiment costs.
Once we’ve implemented the campaigns using one of the methods described above, we should measure campaign performance. The main measurements are Return Rate Uplift, ROI, and Engagement Lift.
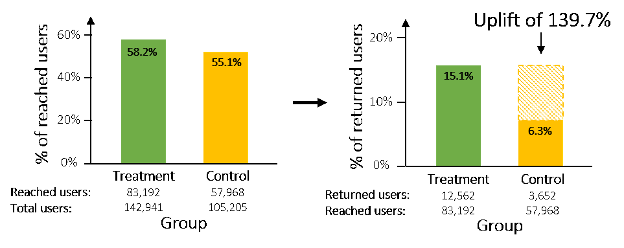
Return Rate Uplift
This measures how much the campaign increased the percentage of users who returned to using the app over the natural return rate.
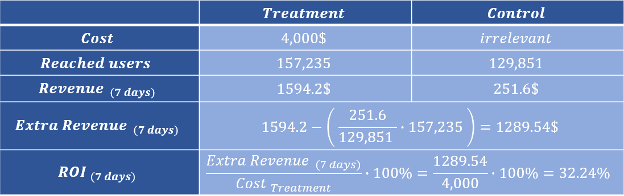
ROI (Return on Investment)
This measures the ratio between the additional revenue from the users that returned due to the campaign, and the cost of the campaign. If we experimented using Wins vs. Wins, the cost of the ads presented to the control group is not included in the calculation, because this cost was required only for the experiment; it is not considered an investment. This measurement is performed in a cohort way, so the revenue is calculated on the first X days of each user in the app after returning.
The table below shows how to calculate the ROI:
Engagement Lift
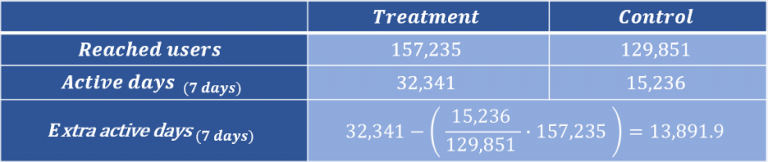
This measurement examines the user’s additional active days in the app. An active day is defined by a unique day in which a user was active in the app. This measurement is also performed in a cohort way, so the count of active days is calculated on the first X days of each user in the app. If we want to normalize this metric to audience size, we can divide the extra active days by the number of users reached in the treatment group.
The table below shows how to calculate the extra active days:
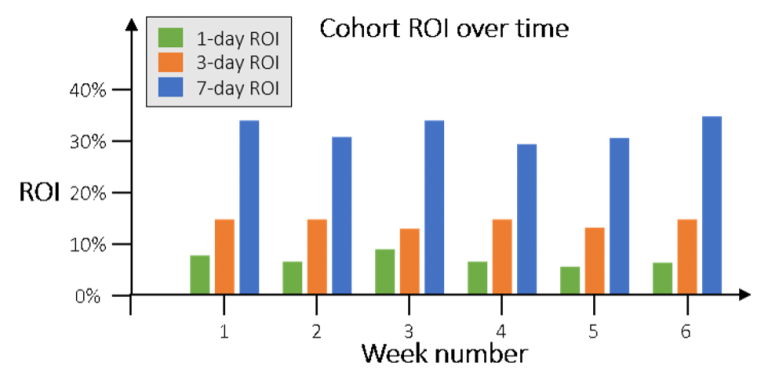
Cohort graphs
ROI can be calculated separately for different time frames (for example, per week) and can be displayed over time for different time periods, as can be seen in the graph below:
Conclusion
There is much to be gained from retargeting campaigns. While they can be complicated to execute, following the tips provided here will help ensure that your retargeting campaign is done right. And remember, always split your audience randomly, and perform both campaigns using the same parameters (price, settings, etc.) and campaign optimizations. If you’d like to learn more about growing your app by retargeting with Bigabid, please click the “contact us” below.