
|
RT 101
CHAPTER 2
How to Measure retargeting
Your ROAS is lying to you.
Here’s the number that isn’t.
The two numbers every retargeting budget runs on,
and which one is actually proof.

01
You already paid for your next growth curve
READ NOW >>
02
Your ROAS is lying to you. Here’s the number that isn’t
Currently Reading
03
Why 90% reach can be worth less than 40%
READ NOW >>
CHAPTER 2
HOW TO MEASURE RETARGETING
Your ROAS is lying to you.
Here’s the number that isn’t.
Every retargeting dollar buys one of two things
Your retargeting dashboard shows 300% ROAS. The campaign looks like a winner, the budget renews, everyone moves on.
Here’s the question the dashboard never answers: how many of those users return organically? A lapsed user opens the game, an ad touch precedes the session, and all subsequent revenue is attributed to the campaign. Attribution can’t separate a return your ad caused from a natural return. The first is incremental growth. The second is paying for revenue you already owned, and both look identical in the report.
Chapter 1 ended on exactly this question, because it decides everything.
Definition
Natural Return Rate (NRR)
Natural Return Rate (NRR) is the percentage of your lapsed users who come back to the app on their own, with no ad exposure and no media spend. It’s the most important number in retargeting, and it’s invisible in standard reporting. It’s worth deciding how to measure it before the first campaign, because it determines budget, targeting, and whether to scale.
Two numbers, answering two different business questions.
The dashboard number: attributed ROAS
This is MMP attribution as you know it from UA, and it answers one question: how are my campaigns performing this week? The MMP credits conversions to the last ad touch, and you get a retargeting ROAS from day one, no test setup required. Use it to operate: compare creatives, segments, and geos, and cut what underperforms.
But know what it costs you to misread it.
First, the two-dashboard problem. After a user is re-attributed to retargeting, MMP reporting runs two views in parallel: the retargeting view credits the retargeting media source, while the UA view still carries the same user under the original install source. The same purchase can sit in both reports at once. Add the two views together and you double-count revenue. Compare retargeting ROAS to UA ROAS head to head and you’re comparing numbers built on different attribution logic. This is by design, not a bug. AppsFlyer documents the behavior and how to reconcile it (Resolve retargeting double attribution).

The same purchase sits in both reports.
Add them and you count it twice.
Second, it overstates the channel. Attribution can’t separate a user your ad won back from one who was already part of your NRR, so attributed retargeting ROAS always reads high. Budget decisions made on this number alone systematically overpay.
The dashboard number is for operating. It is not proof.
The proof number: incremental lift
Incremental lift answers the question attribution can’t: is this channel creating revenue I would not have had? It’s measured, not modeled: a randomized controlled experiment, the same logic as a clinical trial, not an estimate of what might have happened. The audience splits randomly. The treatment group is eligible for ads, the control group is held out. The control group measures your Natural Return Rate. Whatever the treatment group does above that baseline is what the budget actually bought:
(treatment conversion rate) minus (control conversion rate) = incremental lift
Run the numbers on a real test. 10,000 control users see no ads; 800 purchase anyway. That’s the Natural Return Rate: 8% of this audience returns organically. 10,000 treatment users see ads; 1,300 purchases. Those 500 incremental payers are revenue that didn’t exist before the campaign. That’s the number a budget conversation should run on. Not “our retargeting ROAS is X,” but “the campaign created 500 incremental paying users, at a known cost each.”
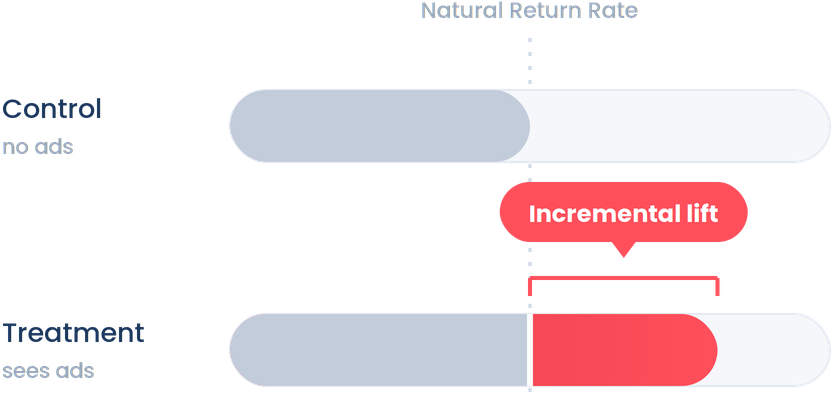
Whatever the treatment group does above that baseline is what the budget bought.
There are cheaper-looking methodologies, and they all fail. Geo-split tests are confounded by market differences and seasonality. Pre/post comparisons credit the campaign with whatever else changed that month. PSA tests produce a valid control group, but you pay real media costs to serve public-service ads to your own holdout. None of them produce a clean answer cheaply.
Ghost bidding does. When a control-group user appears in an auction the campaign would have bid on, the system logs a ghost bid: same eligibility rules, same moment, no ad served, no media cost. Both groups are measured against identical auction opportunities, so the comparison holds, and because no media is bought for the control group, the measurement itself costs nothing to run. You may see this family of methods called ghost ads elsewhere in the industry. Ours runs pre-bid, before any auction is won, which is exactly what keeps the media cost at zero. And because it costs nothing to run, it doesn’t have to be a one-off: every Bigabid retargeting campaign can ship with the control group built in, so uplift is a standing report rather than a quarterly project.
Six rules for an incrementality test you can actually trust
An underpowered test produces a noisy number, and someone will treat that number as truth.
1
Run 2 to 3 months (4 to 7 weeks minimum)
So the result reaches statistical significance rather than reflecting a good week.
2
Test users at 1 to 90 idle days
That’s the range where incremental lift is measurable, because it sits far enough from the NRR-heavy window to produce a clean read.
3
Pause other retargeting vendors
Or provide audience exclusion lists. If another vendor reaches your control group, the baseline is contaminated.
4
Use retargeting creative
Recycled UA assets underperform, and weak creative can make a strong channel read incremental-negative.
5
Use deeplinks
Sending a returning user to a generic app open rather than the place the ad promised costs conversions that belong in the treatment group.
6
Ask for the split, then audit it
A credible partner provides device-level group assignments so you can validate the test against your own first-party data. Have the lists sent daily or weekly and check the sizes against the split: an 80/20 split comes back at exactly 4:1, within a hundredth. If the ratio drifts, the split isn’t what you were told. If you can’t audit the control group, you’re trusting, not measuring.
And when the results come in, read one KPI first: lift in returning payers, the ~5% of players who ever convert to payers and carry nearly all of IAP revenue (AppsFlyer).
Any positive lift means the spend is creating value; a 10 to 15 percent lift in returning paying users is a significant outcome. Revenue-level metrics need longer measurement windows, because a single whale landing in either group can swing a short test. They belong to the advanced stage of a program, not week three.
What this means for your budget
Run the dashboard number from day one; it keeps campaigns honest week to week. Run one clean incrementality test early; it tells you whether the channel deserves a budget and how much your attributed numbers overstate, so once you know your Natural Return Rate you can read attributed ROAS with the right discount. Better still, keep the holdout running, so the answer stays current instead of expiring with the test. Then size the channel on cost per incremental payer, the one KPI that survives a CFO’s questions.
Teams that measure this way stop having the “would they have returned organically?” argument. They know. The debate moves from whether retargeting works to how big it should be, which is a better conversation to be in.
Measurement tells you whether retargeting deserves a budget. The next chapter is what makes that budget work harder: which lapsed segments justify a bid, what to serve a user who already knows your game, and why one partner’s 90% reach can be worth less than another’s 40%.
That’s chapter 3. It lands in the course area the day it ships.
RT 101 is written by Bigabid, the retargeting DSP for mobile games. No fluff, no black boxes.
New chapters land in your inbox first, and the course area updates the same day.